A Window into the Economic Recovery
It can be instructive to zoom in on a business and use “micro” economic data to take a pulse on broader “macro” economic trends. We own one business in our model portfolio* – Visa – that provides a particularly interesting view into global economic activity by using this framework.
As the operator of the largest payments network in the world, Visa is uniquely positioned to capture trends in consumer behavior, travel, and the health of the economy. Visa’s most recent quarterly earnings presentation is a treasure trove of insights.
This first chart is a picture worth a thousand words. Showing monthly growth (or rate of change) in processed transactions, we see the steep drop in economic activity in the spring of 2020, the rapid rebound off the lows last summer, a pause in activity over the winter as COVID-19 cases picked back up, and then a massive surge in transaction activity as shutdown mandates were lifted in the spring of 2021 and consumers flush with cash rushed out into the world to try and regain some sense of normalcy in their lives.
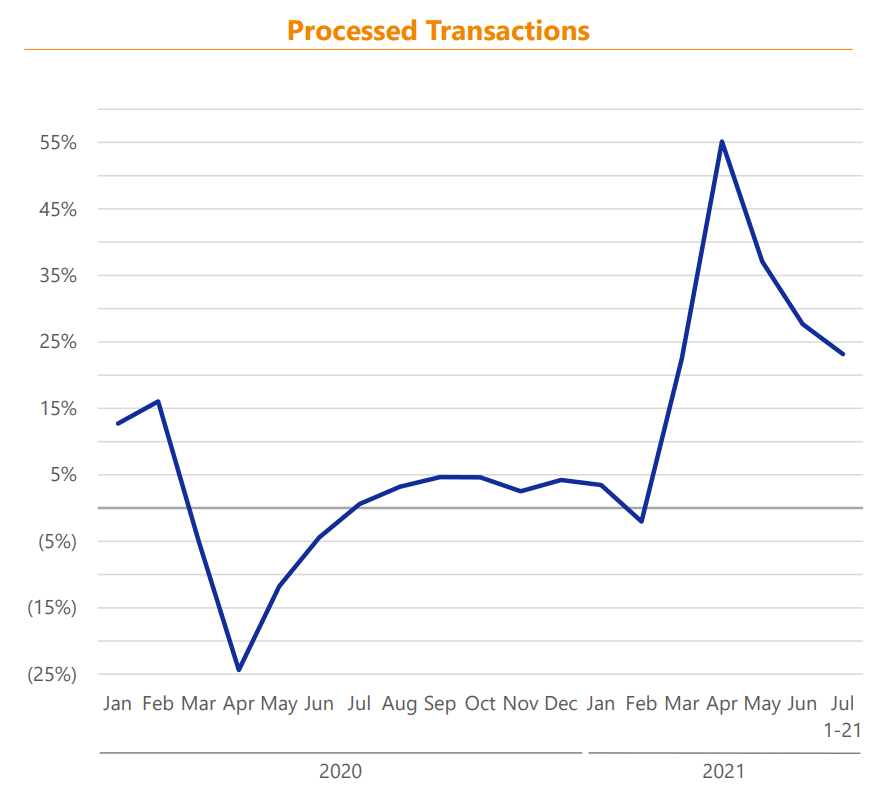
Source: Visa FQ3 Earnings Presentation
Looking at the next chart, we can zoom in on trends related to international markets for goods, services, and travel. These cross-border volume metrics are indexed to 100 for 2019 data. Cross-border transactions that do not require a credit or debit card to be physically present (ie. digital transactions) have soared above 2019 levels, particularly if the purchase is not related to travel (the bright yellow line). However, total cross-border volumes (the blue line) are still depressed relative to 2019.
Interestingly, cross-border payment volumes for travel (the dark orange line) are continuing to regain ground relative to 2019, but the rebound in total cross-border volumes stalled in June and July. This may be indicative of the fact that consumers are shifting their spending away from certain goods and services that were popular during lockdowns in order to allocate more of their spending back to travel.
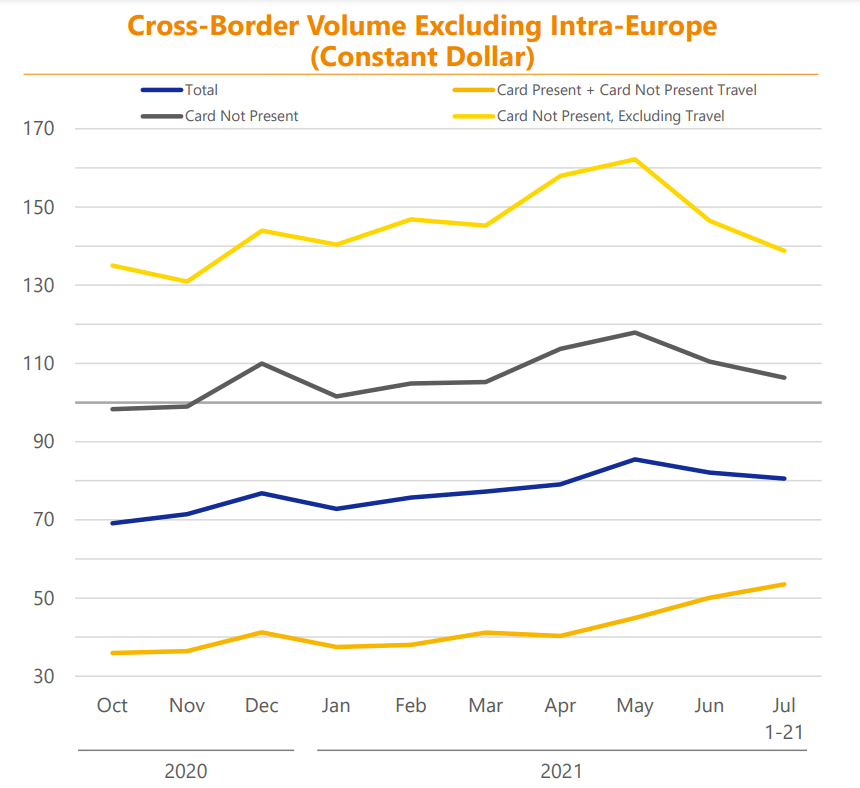
Source: Visa FQ3 Earnings Presentation
The last chart shows the weekly growth (or rate of change) for US payments volumes relative to the comparable period in 2020. This chart may help explain why economists are expressing concerns that the Delta variant could put a dent in their otherwise rosy forecasts for economic growth in 2021. While it would be expected for the weekly rate of change to slow down as current period numbers are compared to levels of economic activity that increased rapidly over the summer of 2020, the hope would be for these numbers to remain positive, even if the general trend in year-over-year change is slowing down.
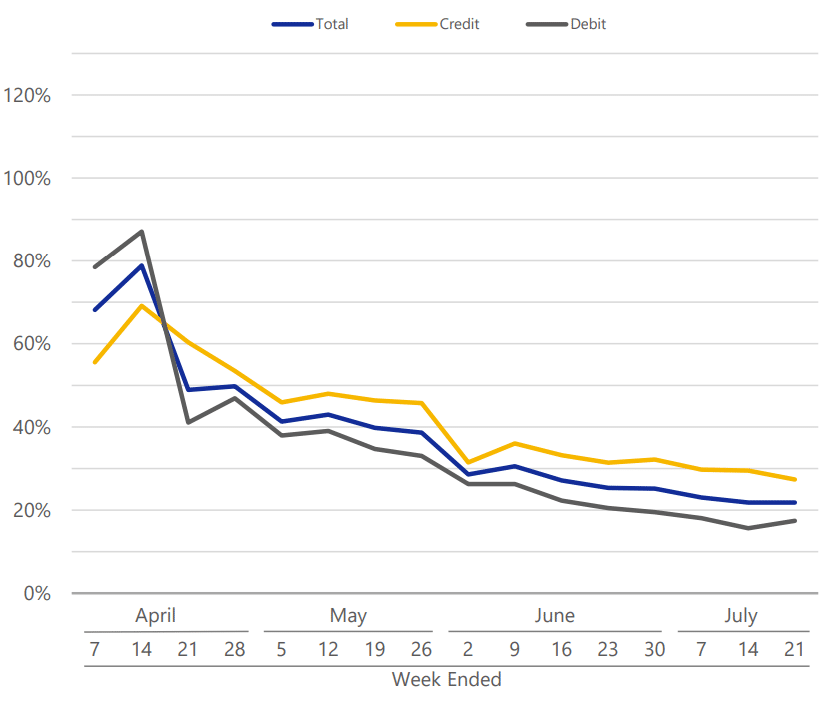
Source: Visa FQ3 Earnings Presentation
It can be a challenge to get a handle on broad economic trends, but Visa’s operating metrics provide a helpful guidepost. These numbers will be fascinating to watch as the recovery from the recession in 2020 continues to unfold.
*The Model Portfolio is not a real cash portfolio. It represents the core direction of our portfolio management strategies. Individual client portfolios are managed in accordance with clients’ specific investment objectives and constraints. Historical results are available upon request.
Peak Asset Management, LLC is an SEC registered investment adviser. This is not an offer to buy or sell securities. Past performance is not indicative of current or future performance and is not a guarantee. The information set forth herein was obtained from sources which we believe to be reliable, but we do not guarantee its accuracy.
share article
Get our latest insights
Subscribe to our quarterly newsletter for all the latest news and information about investing and financial planning.