Where Does the Market Go From Here?
Wall Street strategists, economists, and market gurus are in the process of sharpening their pencils and publishing market forecasts for 2022. These forecasts often include year-ahead price targets on major indices like the S&P 500.
Forecasting short-term market returns is a futile exercise and we would recommend that these forecasts and price targets be duly ignored. That being said, there is a rationale for analyzing where we stand in the market today and what it may imply for long-term market returns.
To decipher where the market may go from here, I’ll share some data from the research teams at Vanguard and J.P. Morgan. The team at Vanguard wrote a great piece in September, “Why market forecasts matter to long-term investors”. They make the case that despite the obvious pitfalls and errors that arise from forecasting future market returns, investors ought to use long-term forecasts to calibrate their expectations, build diversified portfolios, and rebalance across asset classes over time. There are numerous ways to forecast future equity market returns that may include expectations about economic growth, corporate profits, and equity valuations. For simplicity’s sake, we’ll focus on the valuation component of forecasting.
Before jumping to their forecast for the next ten years, Vanguard highlighted where they erred in their forecasted returns for the prior decade. Back in 2011, Vanguard dramatically underestimated the future returns for U.S. equities, while they overestimated future returns for international equities (see the graphs below).
However, actual returns for the more diversified 60/40 portfolio (60% stocks and 40% bonds) over the last 10 years were remarkably close to the Vanguard team’s initial forecast in 2011. The author from the Vanguard team, Joe Davis, notes that “[t]he data reinforce our belief in balance and diversification. We believe that investors should hold a mix of stocks and bonds appropriate for their goals and should diversify these assets broadly, including globally.”
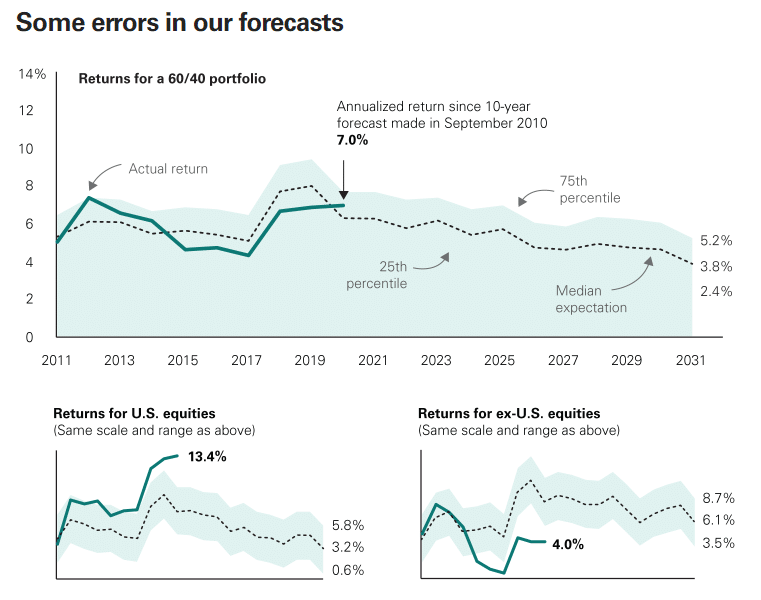
Source: Vanguard, Why Market Forecasts Matter to Long-term Investors, September 23, 2021
How do historical valuations inform where things stand today and where the market may go from here? The graphic below is from Vanguard’s economic and market outlook for 2022. Based on their analysis and selected valuation measure, their team has identified global equity asset classes as either fairly valued or overvalued relative to history.
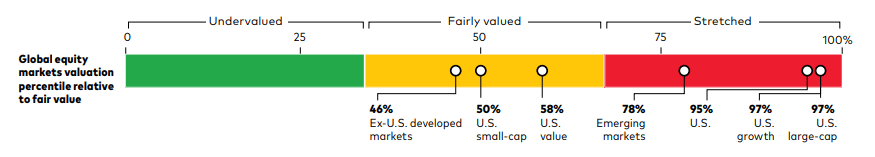
Source: Vanguard, Economic and Market Outlook for 2022: Striking a Better Balance, December 13, 2021
Davis argues that: “Just as low valuations during the global financial crisis supported U.S. equities’ solid gains through the decade that followed, today’s high valuations suggest a far more difficult climb in the decade ahead.” We tend to agree. Elevated market valuations today imply a higher probability that market returns may be muted (compared to the last decade) over the next 5-10 years.
The chart below from J.P. Morgan tells a similar story. At a forward P/E multiple of 21.2x as of December 31st, the valuation of the S&P 500 – based on the price that investors are paying for the earnings that companies are expected to generate over the next year – is higher than average. When that’s the case, the subsequent 5-year returns on the S&P 500 are more likely to be lower than average.
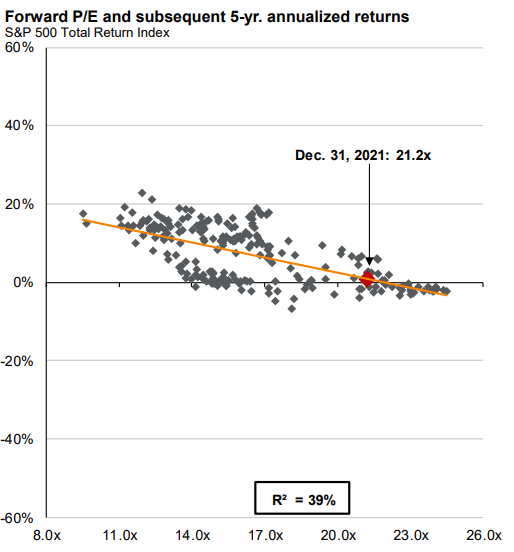
Source: JP Morgan, Guide to the Markets, December 31, 2021
There are numerous issues with the P/E multiple as a valuation metric, and when we look at a business, we are far more interested in the price we are paying for operating cash flows versus accounting earnings. That being said, it’s an instructive exercise to review the historical record (using numerous valuation metrics) and calibrate expectations for future market returns accordingly.
Putting aside valuations, the S&P 500 is up 365% (including dividends) over the last 10 years. That implies a roughly ~13.8% annualized total return. While we may very well be in the midst of a multi-decade, secular bull market, it doesn’t hurt for investors to temper their expectations for the next decade. At the very least, we can expect intra-year volatility to be far more interesting than it was in 2021. Over the past 42 years the S&P 500 has seen an average intra-year drawdown of 14%; in 2021, the S&P 500 only declined 5% before finishing the year up 27% (not including dividends).
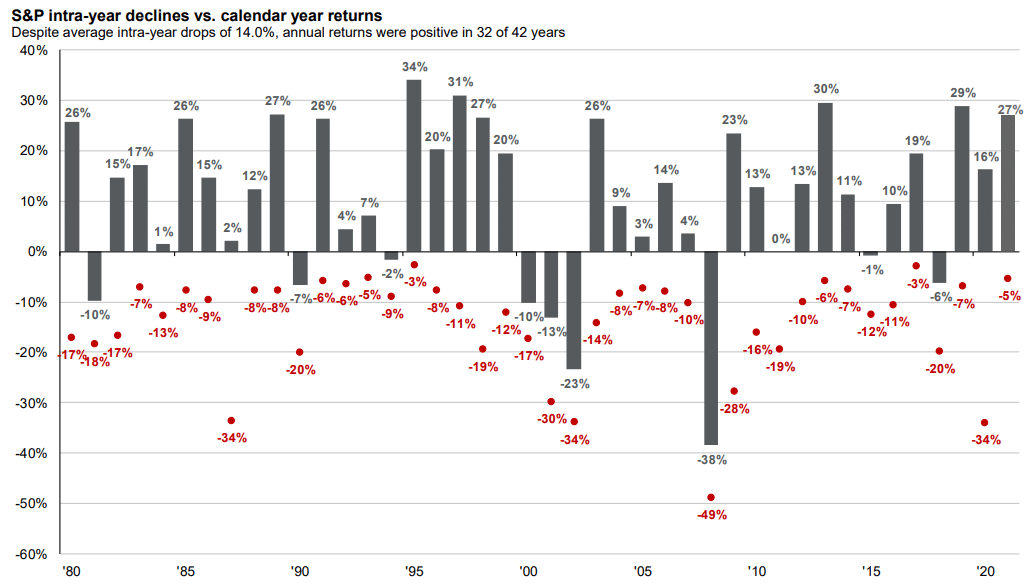
Source: JP Morgan, Guide to the Markets, December 31, 2021
Importantly, elevated market valuations and long stretches of above-average market returns do not imply that investors should rush for the exits and sell all of their stocks. The takeaway is simply that investors ought to be cautious, moderate their expectations for future returns, trim their winners, and rebalance back to target equity allocations that are consistent with their ability (and willingness) to take risk. Conversely, when valuations are depressed, it may be prudent for investors to increase their exposure to riskier assets like stocks. As the market fluctuates up and down, volatility should in fact provide opportunities for the disciplined, long-term investor.
When I sat down to cull the articles and data that we’ve linked to in this blog, I also stumbled across the checklist below from another Vanguard research presentation. I thought this was a great summary of “New Year’s resolutions” for investors, particularly as we contemplate where the market may go from here:
- Be skeptical of expected returns, beyond expected risks.
- Develop prudent investment policy statements.
- Maintain discipline and manage expectations.
- Set appropriate saving and drawdown plans.
- Diversify, rebalance, and keep costs low.
- Control what you can.
- Do no harm.
From all of us at Peak, have a safe, healthy, and Happy New Year!
Peak Asset Management, LLC is an SEC registered investment adviser. This is not an offer to buy or sell securities. Past performance is not indicative of current or future performance and is not a guarantee. The information set forth herein was obtained from sources which we believe to be reliable, but we do not guarantee its accuracy.
share article
Get our latest insights
Subscribe to our quarterly newsletter for all the latest news and information about investing and financial planning.